| TORQUE ANALYSIS |
An analysis of continuous rotating torque over 360° or more can be a powerful tool in determining a variety of
application-related bearing problems. MicroTorqueTM testers manufactured by Measurement Research, Inc. have torque resolution to 10 mg-mm (0.000014 oz-in) and can show raceway damage, contamination, misalignment and lubricant issues in small bearing assemblies. |
 |
 |
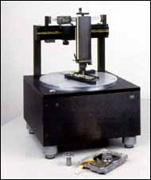
M15 Torque Tester
Measurements Research, Inc. |
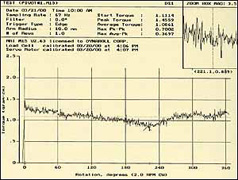
Typical torque trace. |
| Typical results of low-level torque testing of assemblies with different faults/characteristics are shown below |
RACEWAY MISALIGNMENT
Typical inner race misalignment of a preloaded bearing pair as shown from a MicroTorqueTM torque analysis where inner rings are rotated during test. Note that almost all preloaded bearing assemblies exhibit this characteristic to some extent. The test is very sensitive and can detect misalignment of <.0001 inch. |
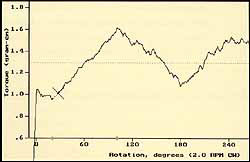
Torque trace of misaligned bearing(s) |
BRINELLING
Brinelling is shown as a series of regularly spaced spikes with negative leading edge.
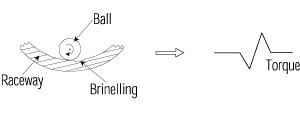
The ball falls into the brinelled depression in the raceway before climbing out. Therefore torque decreases as brinelling is encountered. Severe brinelling may cause multiple spikes where the leading edge can be positive, since raceway becomes rippled from damage. |
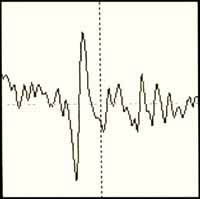
Torque trace of brinelled bearing(s) |
CONTAMINATION
Contamination is shown as a series of irregularly-spaced spikes with positive leading edge.
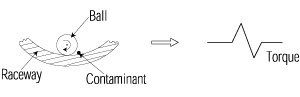
The ball has to climb over the contaminant before falling off the back side. Therefore torque increases as contaminant is encountered. |
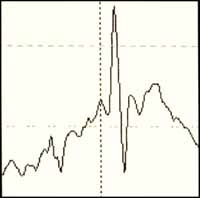
Torque trace of contaminated bearing(s) |
|
| General Note: An analysis of periodic factors of the torque can show different contributions from bearing cage, grease and other elements.To interpret these results, it is necessary to know internal bearing characteristics, and over-analysis is cautioned. |
| |
| STIFFNESS |
Axial stiffness is increased and radial stiffness is diminished for larger radial play (higher ball contact angle).
Axial stiffness of a bearing at a given (axial) preload is:
Axial stiffness (Newton / meter) =
Change in preload force (N) / Corresponding change in displacement (m) = Δfa/ Δδ
The stiffness of a preloaded bearing assembly is determined by the inverse slope of the preload vs. displace ment curve for the bearings used (see page 32).
Example: |
Using displacement vs. preload curve for R168 type bearing shown on page 32, calculate axial stiffness (N/m) at 0.45kg preload for radial play=8 microns. |
From graph: |
Displacement at .45kg preload = 2.61 microns
Displacement at .50kg preload = 2.78 microns |
Stiffness (N/m) = 0.5 - 0.45 . 9.81 = 2.88 . 106 N/m
(2.78 - 2.61) . 10-6 |
|
| |
| RESONANCE |
Any preloaded assembly using bearings will have an inherent resonance frequency according to the mass and bearing stiffness values in axial and radial directions. There are 3 typical resonance modes:
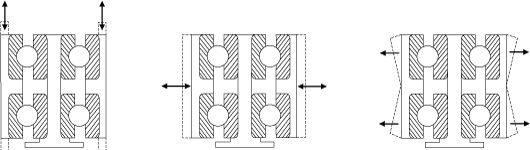 |
Axial mode
resonance |
Radial mode
resonance |
Rocking mode
resonance |
|
Resonance frequency is determined by measuring the energetic coupling between the shaft and housing. There are 2 methods typically used:
(a) Power spectrum method. A source of white noise or swept sine wave with flat power spectrum over .5 to 20KHz (typically) is applied to the shaft of the assembly. The motion of the housing is monitored through a transducer (accelerometer, magnetic, LDV, or other) and fed into a dynamic signal analyzer. The FFT of this signal gives a power spectrum that will show a peak at resonant frequency(ies). A ping hammer can also be used to provide the stimulus to the assembly. Using a transfer mode where a second transducer measures the actual input motion of the shaft and the difference between this and output is analyzed can reduce errors from fixture response.
(b) Phase shift method. The shaft is excited with a variable frequency signal source and the phase-shift between this signal and the motion of the housing is monitored. The phase-shift is 180° at resonance.
It can be difficult to correlate resonance measurements for an assembly since the method used, fixturing and damping mass will affect results. For more information on this subject, contact SWC engineers. |
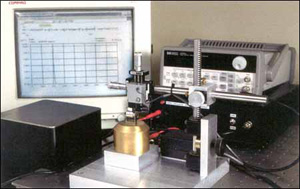 |
| Radial resonance test (Courtesy Measurement Resarch, Inc.) |